


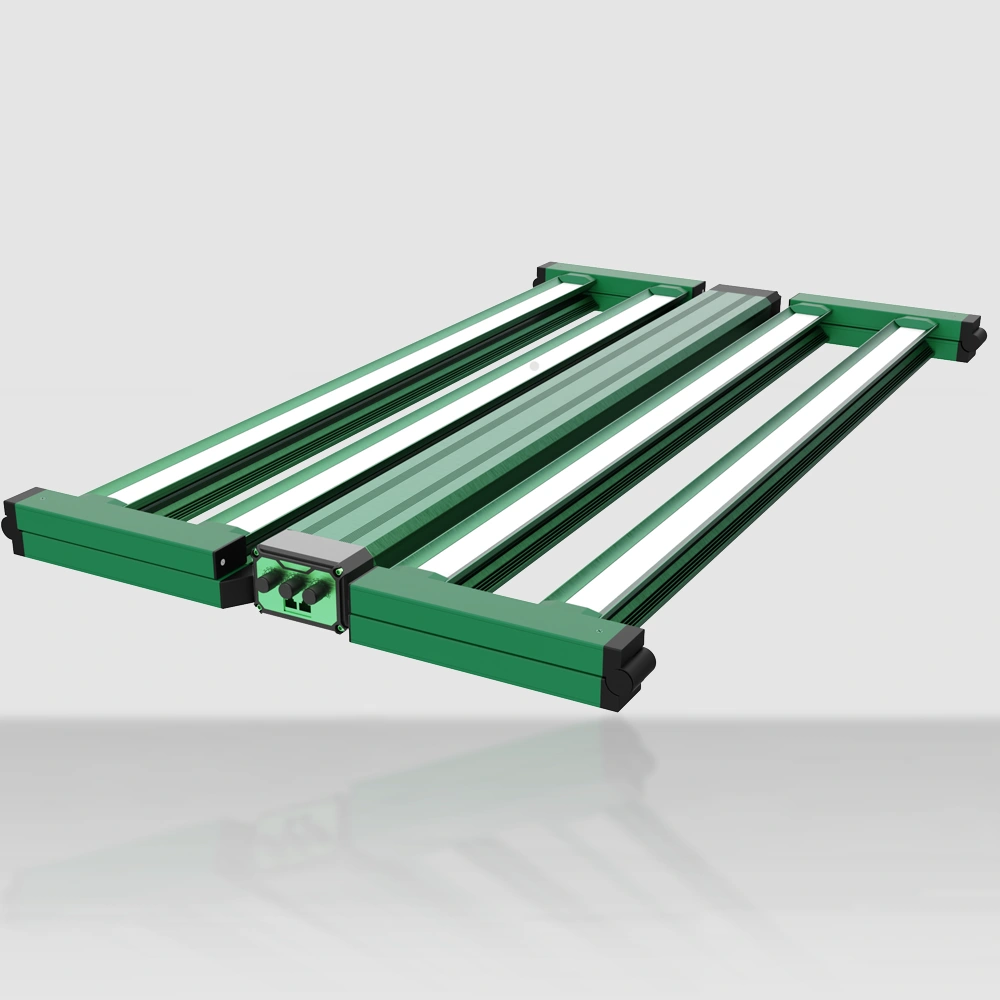

Abstract: Many growers, when purchasing plant lights, are swayed by claims like "PAR value up to xxx" or "full-spectrum PAR coverage," only to find that yields fall far short of expectations in actual use. The problem often lies in the fact that the PAR data you see may not reflect the light you are actually using. This article helps clarify four of the most misunderstood optical concepts: PPFD, PAR, PPE, and DLI, and helps you establish a professional grower's framework for assessing the light environment. If you happen to be a professional grower, feel free to leave a comment and exchange ideas for mutual improvement.
Target Audience: Indoor farm technical managers, greenhouse supplemental lighting purchase decision-makers, growers with serious requirements for the light environment
Estimated Reading Time: 8 minutes
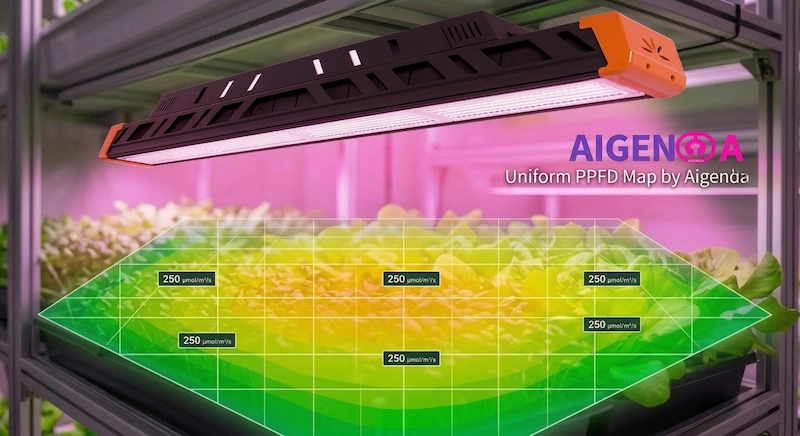
I. Why do crops still grow poorly even when PPFD measurements show up as acceptable?
Let's look at a real dialogue first.
Grower A: "I bought a light lamp labeled 800 µmol/m²/s PPFD, hung it 30 cm above the canopy, and ran it according to the manufacturer's recommended photoperiod. But after three weeks, I found that the middle leaves were thin and the lower leaves showed almost no effective growth. I switched to a lamp labeled 600 PPFD, and the overall growth was more uniform. Could the PPFD number be fake?"
The answer isn't so simple. Both lamps may not be "lying," but the difference lies in the uniformity of light distribution, spectral structure, and measurement location. To understand why the "seemingly weaker" lamp is more effective, we need to start with the measurement logic.
II. What is PAR? Why is it just a "range," not a "quality"?
PAR (Photosynthetically Active Radiation) is defined as the total number of photons in the wavelength range of 400–700 nm. The key limitation of this concept is: PAR only defines the wavelength range and does not distinguish the actual contribution of different wavelengths to photosynthesis.
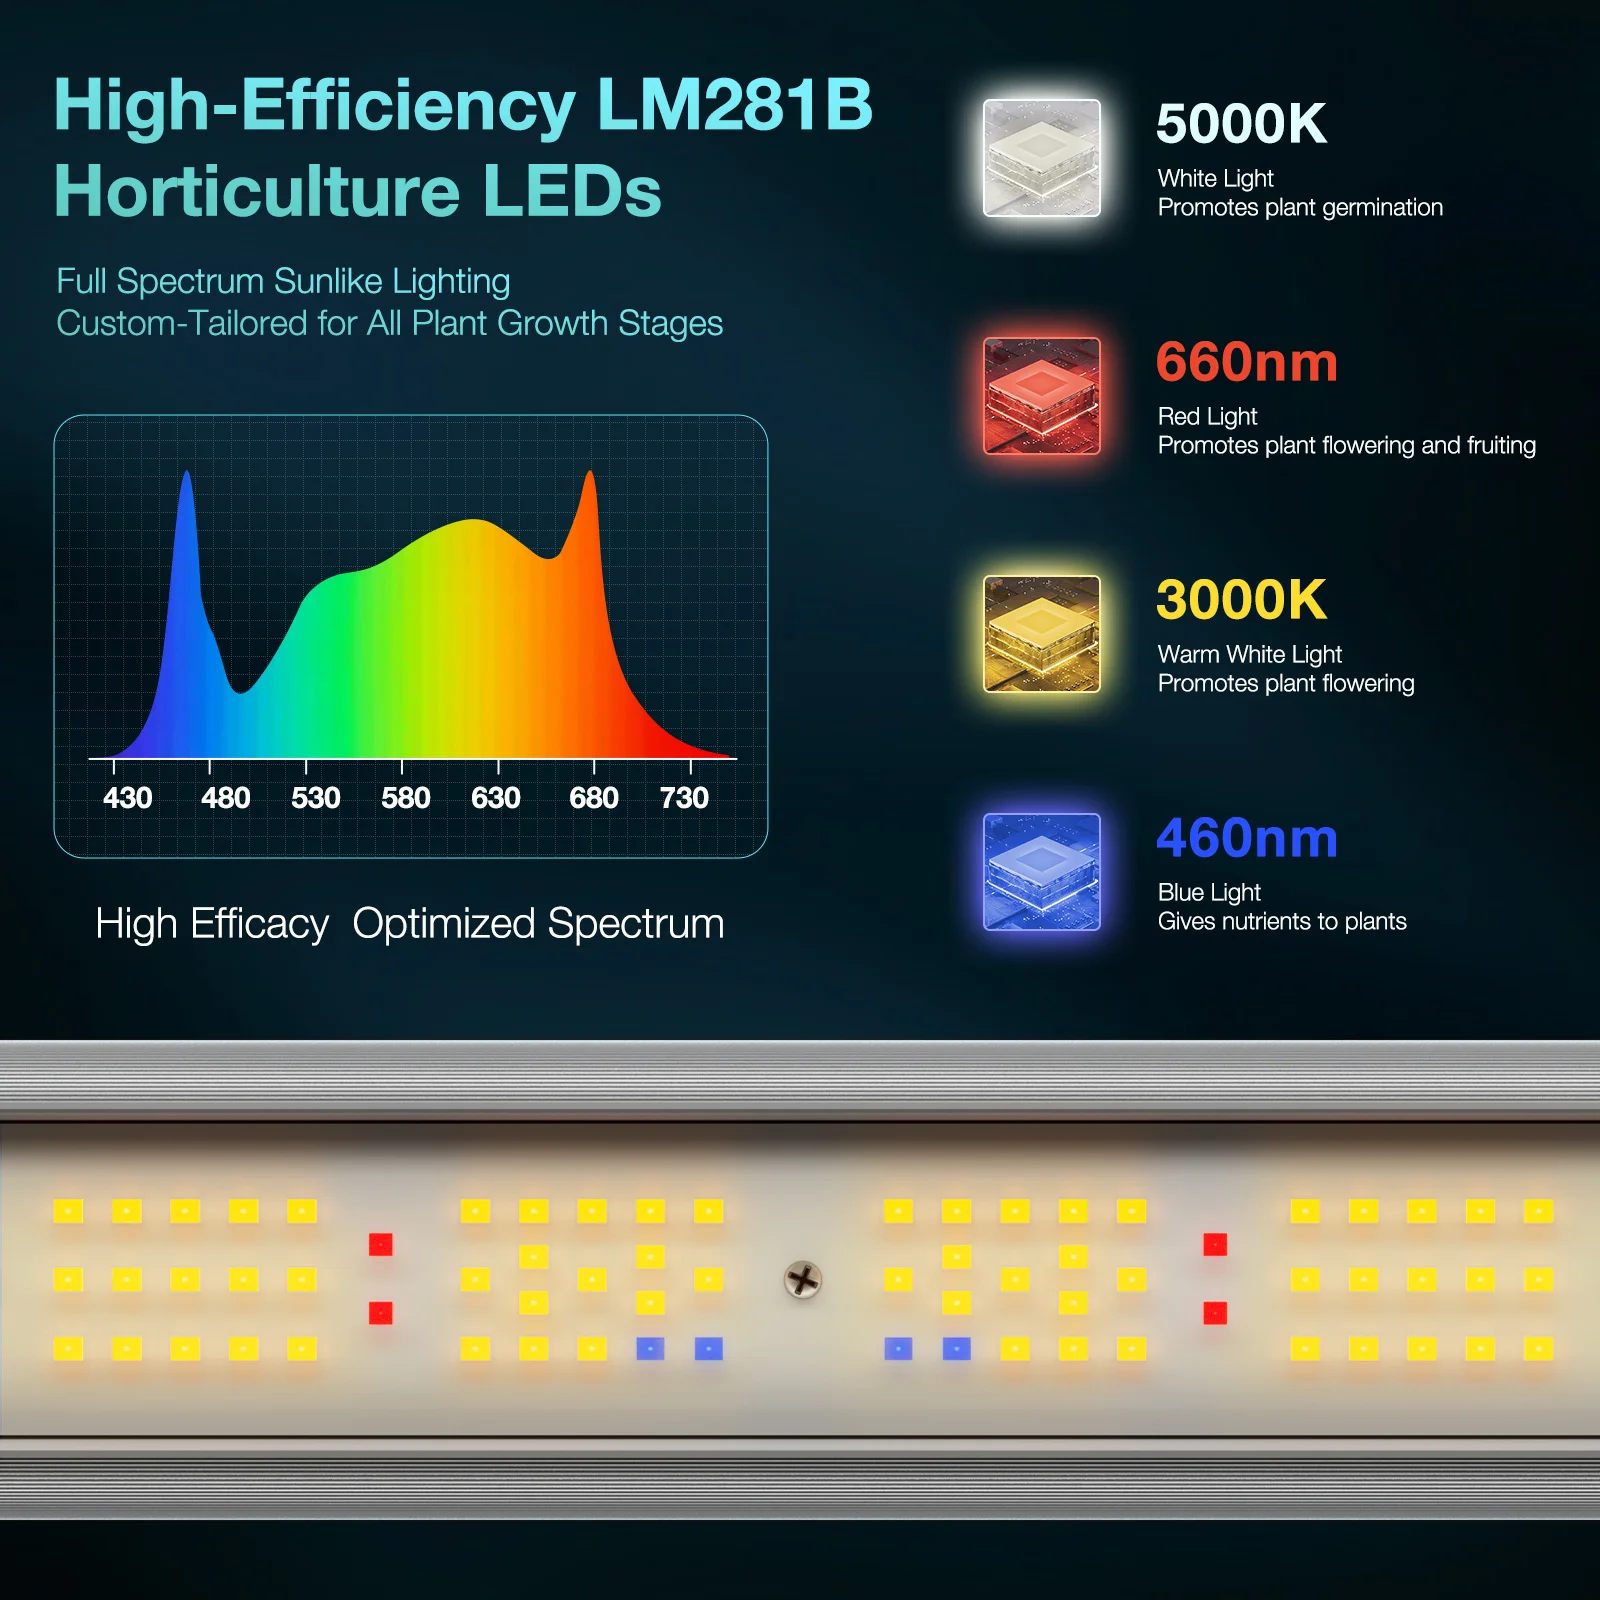
In other words, a 660 nm red photon and a 520 nm green photon have the same weight in the statistical scope of PAR. However, the absorption efficiency of these two photons by plants differs greatly. McCree's classic study in 1972 demonstrated that red light (600–680 nm) and blue light (420–470 nm) have the highest relative quantum efficiency for photosynthesis, while green light (500–560 nm) is significantly lower.
The problem is: a beam of light with a high PAR value, if its spectrum is biased towards the green or yellow light band, will actually drive photosynthesis less efficiently than a light source with a lower PAR value but a spectrum focused on red or blue light.
This is the first reason why "PAR looks good but is not practical."
III. PPFD is not about "how bright the light is," but "whether photons are landing on the leaves."
PPFD (Photosynthetic Photon Flux Density) is the number of 400–700 nm photons reaching the plant canopy per unit area per unit time, measured in µmol/m²/s. This is the core indicator most commonly used by growers to assess light conditions. However, PPFD has three easily overlooked dimensions:
3.1 PPFD is a "point measurement," not a "surface measurement."
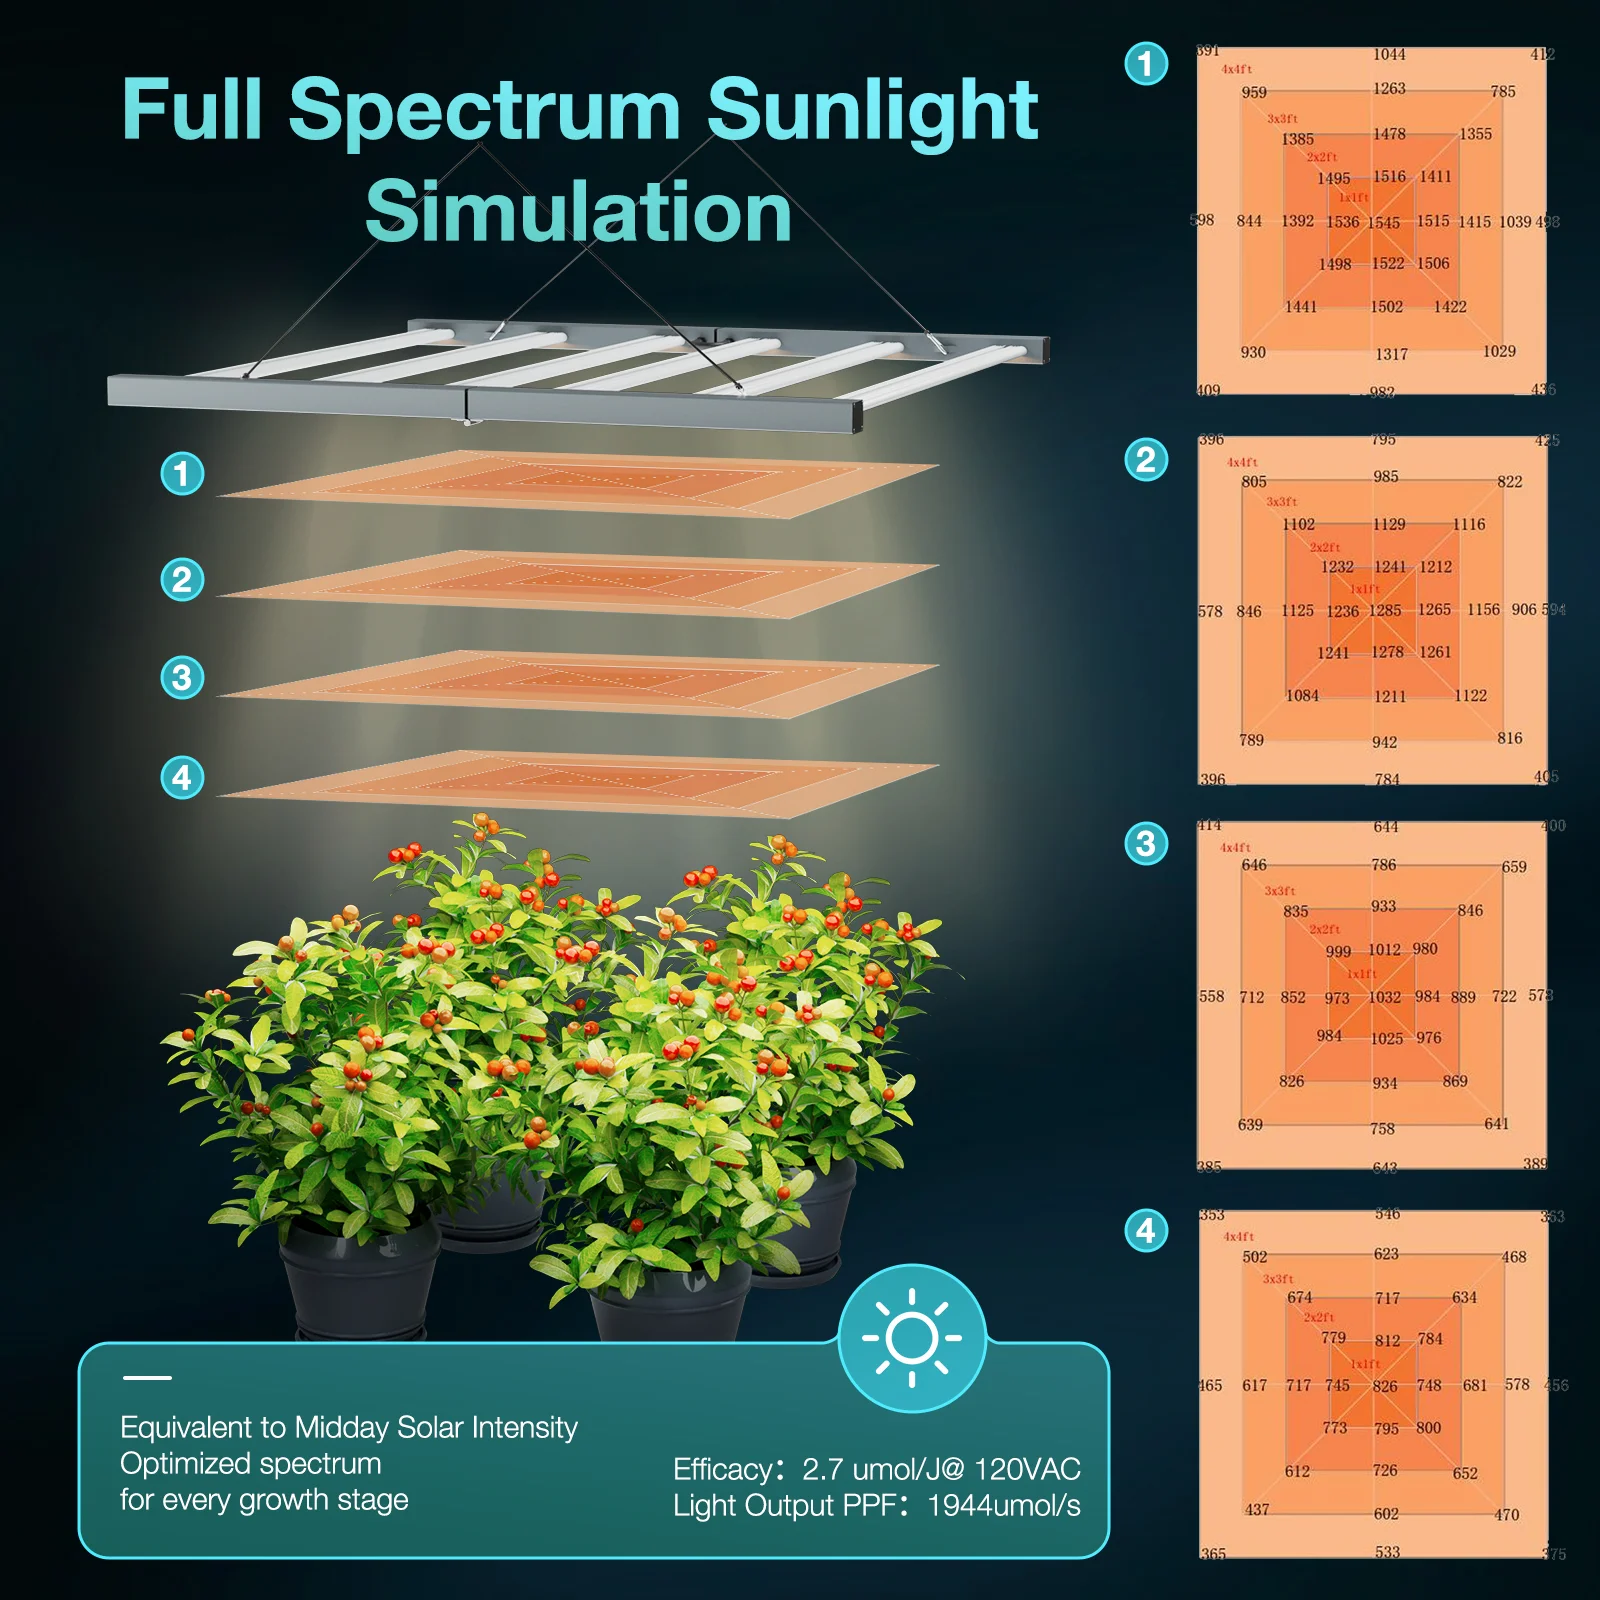
The PPFD of a light source is usually labeled as the value at a single point—typically the center reading at a standard distance (e.g., 30 cm or 45 cm) directly below the light source. In reality, the light intensity at the edge of the light source may only be 40%–60% of that at the center.
Case Study: In a study on supplemental lighting for greenhouse tomatoes at Wageningen University in the Netherlands, the uniformity of horizontal light distribution of supplemental lighting fixtures (the ratio of PPFD at the center to that at the edge) was used as a core indicator. Their research found that for every 10 percentage point increase in uneven light distribution, yield consistency among plants decreased by approximately 6–8% (Vincenzi et al., 2025, Frontiers in Plant Science). This explains why a high PPFD at the center ≠ good overall crop growth.
3.2 PPFD must be linked to photoperiod.
PPFD tells you "how strong the light is," but it doesn't tell you "whether there is enough light." The true determinant of daily light accumulation in crops is DLI (Daily Light Integral), measured in mol/m²/day.
The calculation formula is:
DLI = PPFD (µmol/m²/s) × Photoperiod Duration (hours) × 0.0036
Example: PPFD 800 µmol/m²/s × 12 hours of light × 0.0036 = DLI 34.56 mol/m²/day.
If you simply raise the lights higher, reducing PPFD to 600, but extend the photoperiod to 16 hours, DLI = 600 × 16 × 0.0036 = 34.56 mol/m²/day – exactly the same. Many growers only focus on instantaneous PPFD, neglecting the elasticity of photoperiod, resulting in inefficient electricity spending.
3.3 PPFD is not equal to "usable light"
PPFD measures "light reaching the canopy," but how much of these photons is actually absorbed by the leaves and used for photosynthesis depends on:
• Spectral structure: Red and blue light utilization is higher than green light (McCree, 1972)
• Canopy transmittance: After upper leaves block light, the light intensity reaching the middle and lower layers can decrease by 60%–80% (especially in hemp and tomato cultivation with high leaf density)
• Leaf angle and orientation: Canopy structures vary significantly among different crops
Therefore, PPFD is a necessary condition, but not a sufficient one. It tells you "how much light hits the leaves," but not "how much of that light is converted into biomass."
IV. PPE: Measuring "Electricity-to-Light Efficiency," Determining Long-Term Costs
If PPFD is about "whether there is enough light," then PPE (Photosynthetic Photon Efficiency) answers "how effectively this lamp converts electricity into light." PPE = Output PAR photon flux (µmol/s) ÷ Lamp input electrical power (W), measured in µmol/J.
Why is this value important? Because electricity costs are one of the largest operating costs in indoor agriculture.
A 2020 economic analysis of agricultural lighting showed that in vertical agriculture, lighting electricity costs typically account for more than 60% of total electricity costs (Eaves & Eaves, 2020, Nature Food). For every 0.2 µmol/J increase in lamp PPE, the resulting electricity cost savings over a 10-year operating cycle often exceed the purchase price difference of the lamp itself.
Currently, the PPE range for mainstream professional-grade LED plant lights is as follows: Lamp Grade PPE (µmol/J) Applicable Scenarios Entry-level 1.8–2.2 Low-density supplemental lighting, home use Professional-grade 2.5–3.0 Greenhouse supplemental lighting, vertical farms High-efficiency grade 3.0 and above High electricity price areas, large-scale commercial cultivation
However, it's important to note that higher PPE is not always better. Some manufacturers sacrifice non-PAR bands like far-red and UVA to achieve high PPE values (because PPE is only calculated for 400–700 nm). However, as discussed in the previous article, far-red and UVA contribute significantly to flowering, fruit setting, and secondary metabolic accumulation. Blindly pursuing high PPE may sacrifice yield-increasing bands.
V. Decision-Making Weights of Four Concepts: What Should You Look for When Buying Lights?
Translate the above concepts into a decision-making framework:
Your Concerns Corresponding Core Indicators Secondary References
Is the light bright enough? PPFD (center value) Light distribution map (center/edge ratio)
Does the daily light intake meet the target? DLI (Digital Licence) Photoperiod flexibility
Is the long-term electricity cost controllable? PPE Purchase price vs. 5-year total cost of ownership
Is the spectrum suitable for my crop? PPFD percentage of each band Are there independent FR/UV channels?
Is the light coverage uniform? Light distribution uniformity Light fixture spacing and mounting height design
VI. A Professional Grower's Checklist
Step one: Define the crop's DLI target. The recommended DLI for cannabis during its nutrient period is approximately 20–30, and during flowering, 30–40; for greenhouse tomatoes, a DLI of 25–35 is suggested; and for strawberries, 15–25. Data varies across different literature sources; it is recommended to refer to the recommended values for each variety.
Step Two: Use PPFD and photoperiod to deduce the required number of light fixtures. Don't just ask "How large an area can one light illuminate?", but rather "At the specified hanging height and spacing, will the canopy PPFD distribution achieve my DLI target?"
Step Three: Request a complete light distribution map from the supplier, not just a single-center PPFD value. Professional light fixture suppliers can usually provide PPFD thermal maps and uniformity data at different hanging heights (30/45/60 cm). Without this data, rigorous engineering calculations are difficult.
Step Four: Use PPE to screen for long-term partners. After meeting spectral and uniformity requirements, PPE is a core variable determining 10-year electricity costs. Professional source manufacturers can usually provide integrating sphere reports from third-party laboratories to verify PPE and spectral parameters.
Conclusion: Data itself doesn't lie, but relying on only one statistic can be misleading.
PPFD and PAR are both useful tools, but using them as the sole criterion is like judging a car's suitability for long-distance transport based solely on its top speed. True professional judgment comes from a comprehensive understanding of light intensity, spectral structure, distribution uniformity, and electro-optical efficiency.
As a source manufacturer of plant lighting spectral and light distribution solutions, we never simply provide a single "PPFD center value" when offering solutions to commercial growers. We provide a complete light environment data package: PPFD distribution map, DLI calculation table, photon percentage for each wavelength band, measured PPE values, and long-term energy consumption estimates.
Want to determine if your current light environment meets standards? Leave your crop type, current lighting brand, hanging height, and daily light duration in the comments section, and we'll help you calculate whether your DLI is sufficient.
Reference sources
1. McCree, K.J. (1972). The action spectrum, absorptance and quantum yield of photosynthesis in crop plants. Agricultural Meteorology, 9, 191–216.
2. Vincenzi, E., et al. (2025). Dose-response of tomato fruit yield to far-red fraction in supplementary lighting. Frontiers in Plant Science, 16, 1618171. https://www.frontiersin.org/journals/plant-science/articles/10.3389/fpls.2025.1618171/full
3. Eaves, J., & Eaves, S. (2020). Comparing the profitability of greenhouse and vertical farming. Nature Food, 1, 12–13.
4. Zhen, S., & Bugbee, B. (2020). Far-red photons have equivalent efficiency to traditional Photosynthetic photons. Frontiers in Plant Science, 11, 581156. https://www.frontiersin.org/journals/plant-science/articles/10.3389/fpls.2020.581156/full
5. PAR & PPFD measurement standards — Apogee Instruments Knowledge Base. https://www.apogeeinstruments.com
________________________________________
This article is for technical exchange and reference only and does not constitute specific procurement advice. Actual lighting environment solutions should be designed comprehensively based on crop variety, facility conditions, and commercial objectives.
